
Add a print at the top of application(_:didFinishLaunchingWithOptions:), delete the app from the device, reinstall it, and launch. That print is what most of us picture as "my app starting." By the time it runs, the system has already built a process, mapped your binary and every framework into memory, fixed up thousands of pointers, and started the Objective-C runtime.
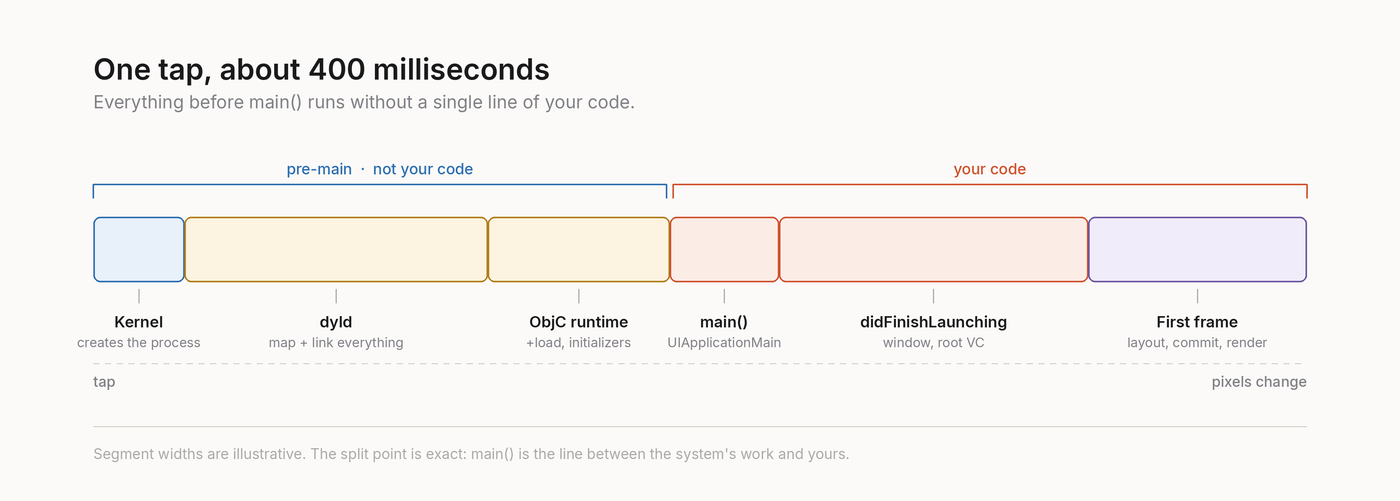
Apple's target for the whole thing, finger leaving the glass to first frame on screen, is 400 milliseconds. Most of it is spent before your app delegate exists.
Two halves, split at main()
Every launch has a line down the middle: the call to main().
Before main(), none of your code runs. The kernel creates the process and hands it to dyld, the dynamic linker, which loads everything your app needs. This half is usually called pre-main.
After main(), it's yours: the app delegate, the window, the root view controller, the first layout pass, the first frame.
Both halves get slow in different ways. Pre-main gets slow when you add frameworks. Post-main gets slow when you do work in didFinishLaunching that could have waited.
What "cold" actually means
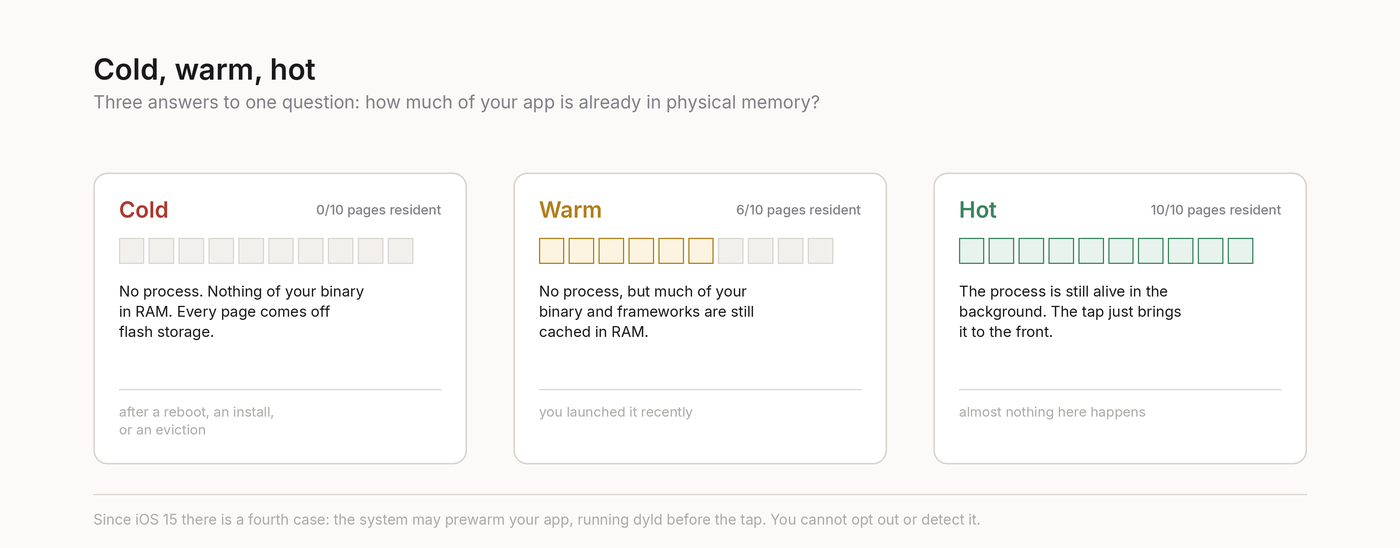
Cold, warm, and hot are three answers to one question: how much of your app is already sitting in physical memory?
A cold launch has no process and nothing of your binary in memory. Every page has to come off flash storage. This is what you get after a reboot, after an install, or after the system evicted you to make room for something else.
A warm launch has no process either, but a good chunk of your binary and the frameworks you use are still cached in RAM from a previous run. Same code path, far fewer trips to storage.
A hot launch means your process is still alive in the background, and tapping the icon brings it to the front. Almost nothing in this article happens.
Cold is the only one you can measure honestly, and it's what a first-time user gets. To force it on a device: reboot, wait a minute or two for the system to settle, then launch.
There is a fourth case that catches people out. Since iOS 15 the system sometimes prewarms an app. It starts the process and runs dyld ahead of time, stopping short of showing anything. When the user finally taps, the expensive half is already done. You can't opt out and there's no official API to detect it, so a launch that looks impossibly fast in your metrics is usually a prewarm.
Where your app lives in memory
A process gets a virtual address space: a huge range of addresses that belong to it alone. On 64-bit iOS that range is far bigger than the device's RAM. Addresses in it are not memory yet. They're a map.
When the system "loads" your app, it does not read your binary into RAM. It calls mmap, which says: addresses X through Y correspond to this region of this file on disk. Nothing is read. A 60 MB binary takes 60 MB of address space and close to zero physical memory.
The bytes arrive later, one page at a time, when something touches them.
Your address space at launch looks roughly like this, low addresses to high:
__PAGEZERO. The first 4 GB, deliberately mapped as nothing. Read, write, or execute here and the process traps. This is why dereferencing a null pointer crashes instead of quietly corrupting something.__TEXT. Your compiled code and constants. Read and execute, never written. Because it's backed by the file on disk and never modified, iOS can drop it from RAM under pressure and read it back later.__DATA_CONST. Pointers that get fixed up once at launch and then never change. Writable during launch, made read-only afterwards.__DATA. Globals and anything else that changes at runtime. Writable for the life of the process.__LINKEDIT. Symbol tables and fixup instructions. dyld reads it during launch and mostly leaves it alone after.- The shared cache. One enormous file holding UIKit, Foundation, libSystem and every other system framework, prebuilt and pre-linked, mapped into every process on the device.
- Heap and stacks, allocated at runtime. The main thread stack is 1 MB; every other thread gets 512 KB.
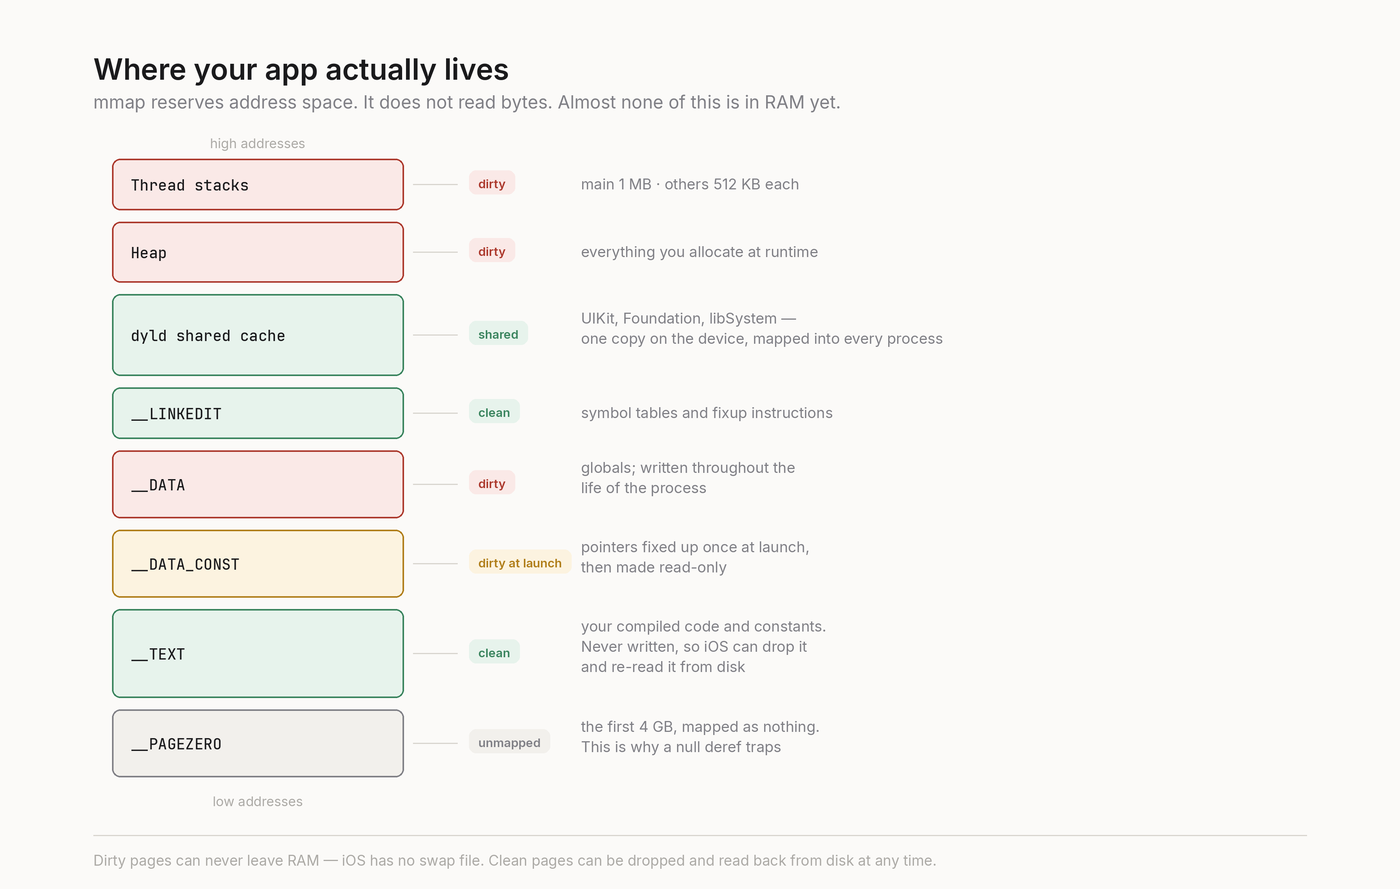
The shared cache is the single biggest reason launch isn't slower than it is. UIKit is not loaded into your process. It's mapped from a copy already resident in RAM and shared by every running app. You pay address space for it, not memory.
Clean and dirty pages
iOS splits memory into 16 KB pages and cares about exactly one distinction: has the process written to this page?
A clean page hasn't been written to. Its contents still match a file on disk, so the system can drop it whenever it needs the RAM and read it back later. Clean pages are cheap.
A dirty page has been written to. Nothing on disk matches it anymore. iOS has no swap file, so it can't be pushed out to storage. It can be compressed in memory, but it can never leave.
Dirty memory is what counts against you, and it's what jetsam looks at when the system picks an app to kill. __TEXT is clean, which is why a big binary is less frightening than it sounds. __DATA is dirty from the moment dyld touches it.
Step 1: the kernel makes a process
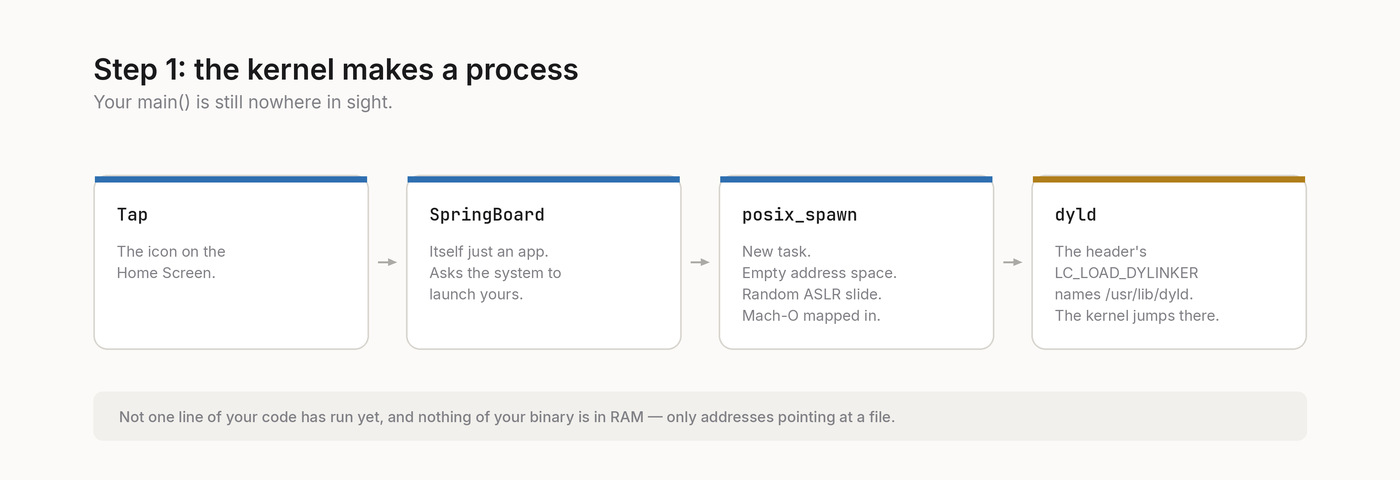
When you tap the icon, SpringBoard, itself just an app, asks the system to launch yours. Underneath, that's posix_spawn.
The kernel creates a new task with an empty address space, picks a random offset (the ASLR slide) so your code doesn't land at the same address every run, and maps your executable in at that offset.
Then it reads the Mach-O header and finds a load command called LC_LOAD_DYLINKER, which names the program that should actually start your app: /usr/lib/dyld.
The kernel sets the entry point to dyld and steps back. Your main() is still nowhere in sight.
Step 2: dyld loads and links everything
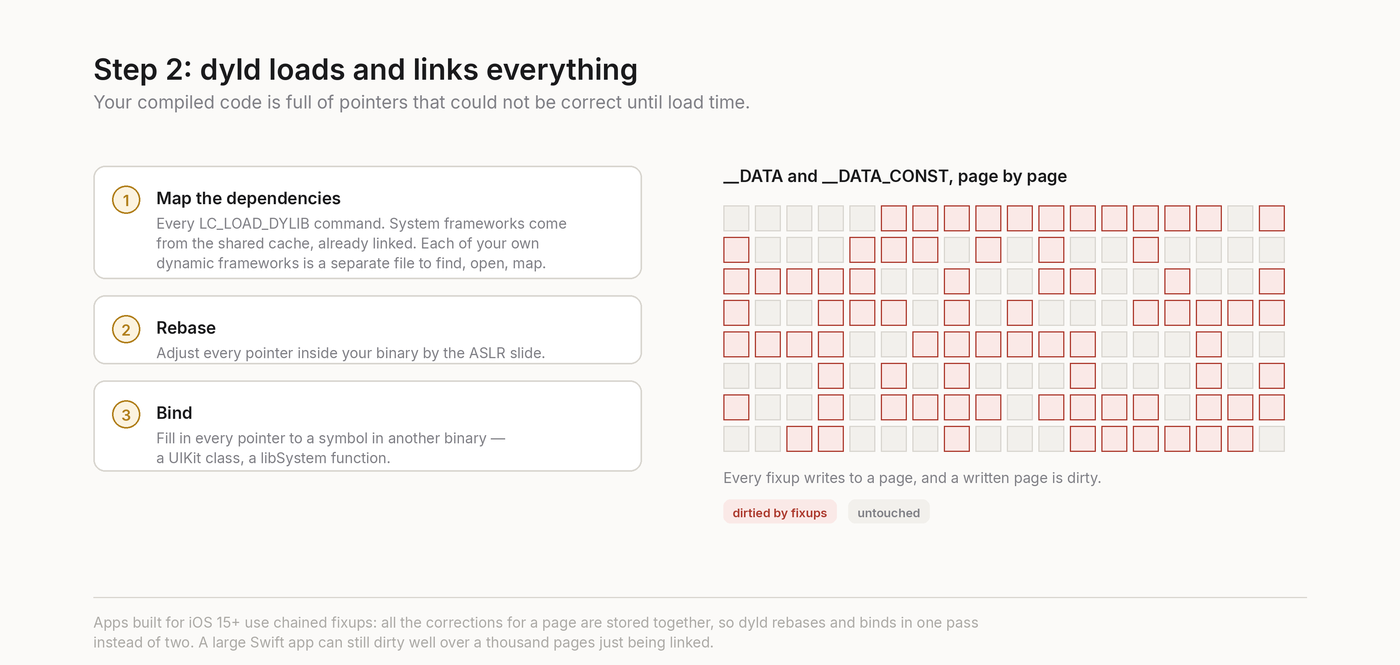
dyld walks your app's list of dependencies, every LC_LOAD_DYLIB command, and maps each one in. System frameworks come from the shared cache, which is fast because the work is already done. Your own dynamic frameworks don't, and each one is a separate file to find, open, and map.
Then comes linking. Your compiled code is full of pointers that couldn't be correct at compile time, because nobody knew the ASLR slide or where UIKit would land. dyld fixes them:
- Rebasing: adjusting pointers inside your binary by the ASLR slide.
- Binding: filling in pointers to symbols in other binaries, like a UIKit class.
Every one of those writes touches a page in __DATA or __DATA_CONST, and a written page is a dirty page. This is where a lot of launch memory cost comes from. A large Swift app can dirty well over a thousand pages just being linked.
Apps built for iOS 15 and later use chained fixups, a compact format where all the corrections for a page are stored together, so dyld handles rebasing and binding in one pass instead of two. Smaller on disk, and memory gets touched once instead of twice.
Step 3: page faults, where the time goes
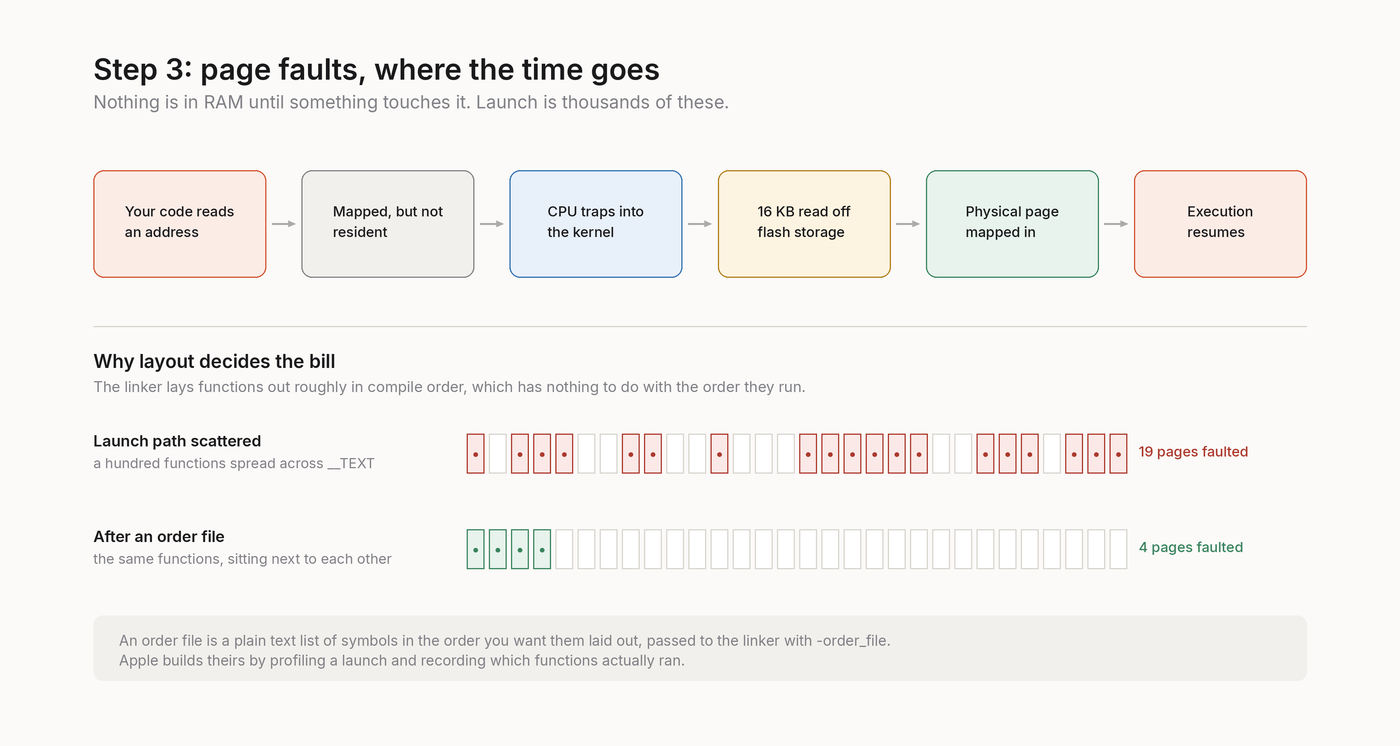
Nothing is in RAM until it's touched. The first time your code reads an address that's mapped but not resident, the CPU raises a page fault. Execution stops, the kernel reads 16 KB off flash storage into a physical page, and execution resumes.
Launch is thousands of these, because it's the first time anything in the process has run.
The cost depends on layout. The linker places functions in roughly the order the object files were compiled, which has nothing to do with the order they run. Your launch path, a hundred functions scattered across __TEXT, can fault in a hundred separate pages, even though those same hundred functions would fit in five pages if they sat next to each other.
You can fix that with an order file: a text file listing symbols in the order you want them laid out, passed to the linker with -order_file. Apple builds theirs by profiling a launch and recording which functions ran.
Step 4: the Objective-C runtime wakes up
dyld hands over to libobjc, which registers every class in every loaded image, uniques every selector, and attaches every category to its target class. The cost scales with how many classes and categories you ship, yours and your dependencies' alike.
Then dyld runs initializers, in this order:
+loadmethods on Objective-C classes and categories.- C++ static constructors and functions marked
__attribute__((constructor)).
+load is the one to watch. It runs for every class that implements it, before main(), whether or not the class is ever used. It can't be deferred and it can't be skipped.
@implementation AnalyticsTracker

+ (void)load {
    // Runs before main(). Always.
    [[self sharedTracker] start];
}

+ (void)initialize {
    // Runs the first time the class is messaged.
    // Often never.
}

@end
+initialize is the lazy version, and usually what people actually wanted. This is mostly a cost you inherit rather than write: it arrives with Objective-C SDKs that register themselves at load time, so you find it by auditing your dependencies.
There's a memory cost on top of the CPU cost: every +load touches a page that would otherwise never have faulted in.
Step 5: main() finally runs
Now your code starts. In a UIKit app, main() is one call:
UIApplicationMain(
    CommandLine.argc,
    CommandLine.unsafeArgv,
    nil,                                   // UIApplication subclass
    NSStringFromClass(AppDelegate.self)    // delegate class
)
You don't normally see it, because @main on your app delegate generates it. What it does:
- Creates the
UIApplicationsingleton. - Reads
Info.plist. - Instantiates your app delegate.
- Sets up the main run loop.
- Starts delivering lifecycle callbacks.
And it never returns. UIApplicationMain enters the run loop and stays there until the process dies.
SwiftUI's @main on an App does the same job through a generated entry point. If you add a UIApplicationDelegateAdaptor, your delegate slots into the same sequence.
Step 6: the launch screen and your callbacks
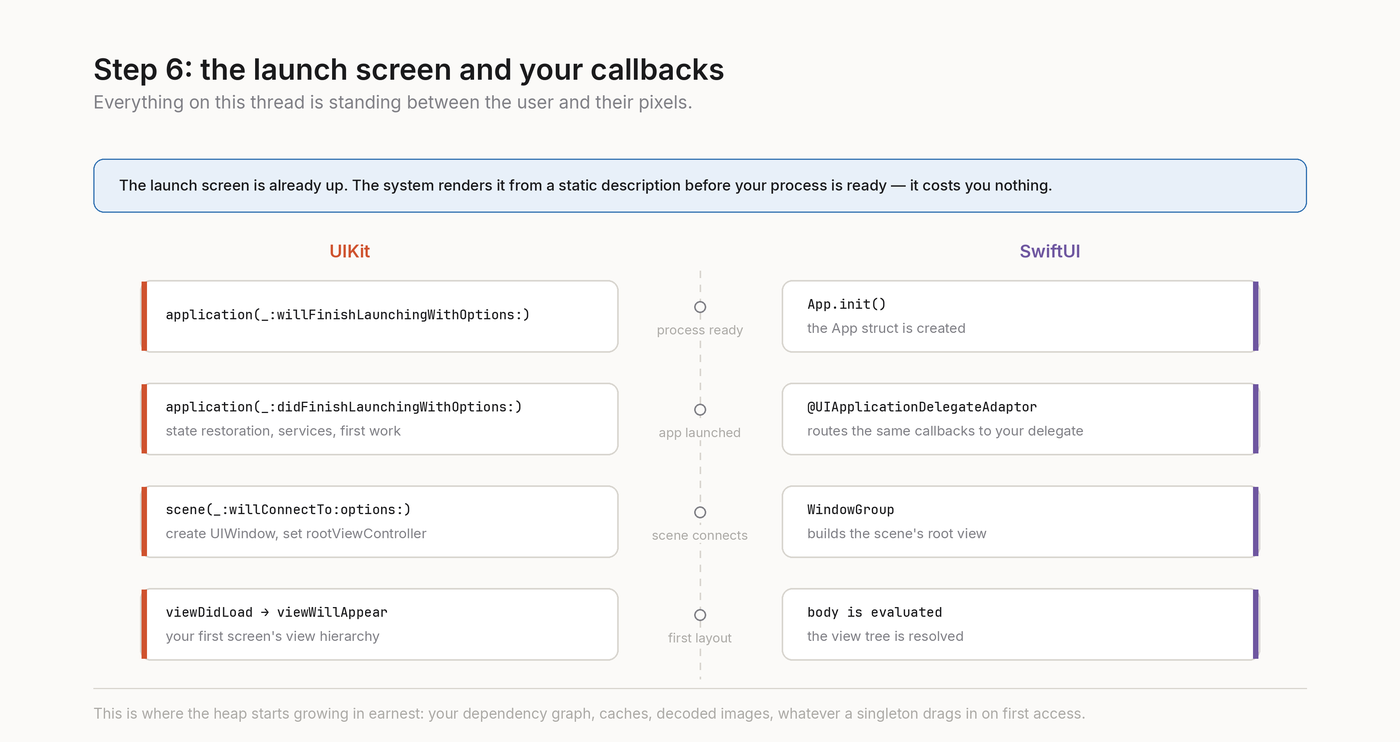
Something is already on screen by now. The system renders the launch screen, from your storyboard or the UILaunchScreen key in Info.plist, from a static description before your process is ready. That's the whole point: it costs you nothing.
Then the callbacks arrive:
application(_:willFinishLaunchingWithOptions:)
application(_:didFinishLaunchingWithOptions:)
scene(_:willConnectTo:options:)          // scene-based apps
You create the window and root view controller in the scene callback, or in didFinishLaunching on older non-scene apps. This is also where the heap starts growing in earnest: your dependency graph, caches, decoded images, whatever a singleton drags in on first access.
Everything on this thread is blocking the first frame. A synchronous network call, a UserDefaults migration, a Core Data stack built eagerly: all of it sits between the user and their pixels.
Step 7: the first frame
Your callbacks return. The run loop ticks.
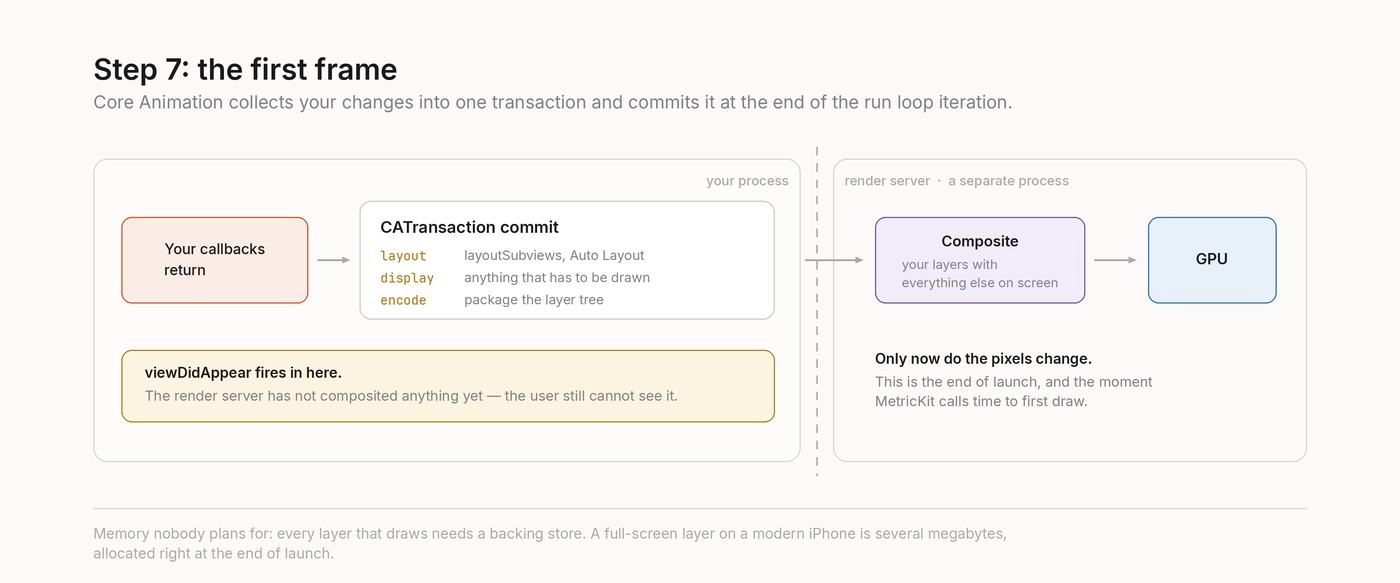
Core Animation collects every change you made into a transaction and commits it at the end of the run loop iteration. The commit walks the layer tree, runs layout (layoutSubviews, Auto Layout solving), draws whatever needs drawing, and encodes the result.
Then it hands the tree to a separate process, the render server, which composites it with everything else on screen and passes it to the GPU. That's when the pixels change.
This is also when a chunk of memory appears that nobody plans for: the backing store. Every layer that draws needs a buffer, and a full-screen layer on a modern iPhone is several megabytes, allocated right at the end of launch.
One consequence worth knowing: viewDidAppear does not mean "the user can see this." It runs during the transaction, before the render server has composited anything. If you're timing launch, viewDidAppear is early.
What you're holding when the screen lights up
Add it up: your dirty __DATA, every framework's dirty pages, the heap your init code allocated, the layer backing stores, and the clean pages currently faulted in.
That total is your launch footprint, and jetsam judges you on the dirty part. iOS has per-device memory limits, and an app over them gets killed. At launch, that looks like a crash with no stack trace anywhere in your code.
The watchdog is the other limit. Take too long and the system kills the process with 0x8badf00d, and the crash report says the app "exhausted real (wall clock) time allowance of 20.00 seconds." You won't hit that with normal code. You will hit it with a synchronous network call on a bad connection.
Measuring your own launch
Instruments has an App Launch template. Profile with it and you get the whole timeline: pre-main, your callbacks, first frame, with a trace of what ran where. It's the reliable tool now. DYLD_PRINT_STATISTICS, the old environment-variable trick, stopped producing output on modern iOS.
For your own markers, use signposts:
import OSLog

let launchSignposter = OSSignposter(
    subsystem: "com.example.app",
    category: "Launch"
)

func setUpRootViewController() {
    let state = launchSignposter.beginInterval("rootVC")
    defer { launchSignposter.endInterval("rootVC", state) }
    // build the view controller
}
Those intervals show up as regions in the Instruments timeline, right next to the system's own.
For real users, MetricKit reports launch times from the field:
import MetricKit

final class LaunchMetrics: NSObject, MXMetricManagerSubscriber {
    func didReceive(_ payloads: [MXMetricPayload]) {
        for payload in payloads {
            guard let launch = payload.applicationLaunchMetrics else {
                continue
            }
            report(launch.histogrammedTimeToFirstDraw)
        }
    }
}
Xcode's Organizer shows the same data aggregated across your users, which is the number they actually experience.
On the memory side, Instruments' Allocations and VM Tracker show dirty size per region. Watch dirty, not resident.
What usually goes wrong
In rough order of how often it shows up:
- Too many dynamic frameworks. Each one is separate work for dyld. Static linking or merging them removes it entirely.
+loadmethods, usually from a third-party SDK registering itself.- Everything built eagerly in
didFinishLaunchingbecause it was easier than making it lazy. - A synchronous network call on the launch path, often "just a config fetch."
- A huge storyboard or a deep view hierarchy on the first screen.
None of these are exotic. They accumulate as an app grows, and the user experiences all of them as the same thing: the app is slow.
The part worth keeping
Most of launch is not your code executing. It's the system building an address space, fixing up pointers, and faulting pages in off flash storage. When you cut a framework or make an object lazy, the saving shows up as fewer page faults and less dirty memory. That's a different mental model from "make the code faster," and it explains why two apps with the same amount of code can launch at very different speeds.